How to Set Up Website Uptime Monitoring
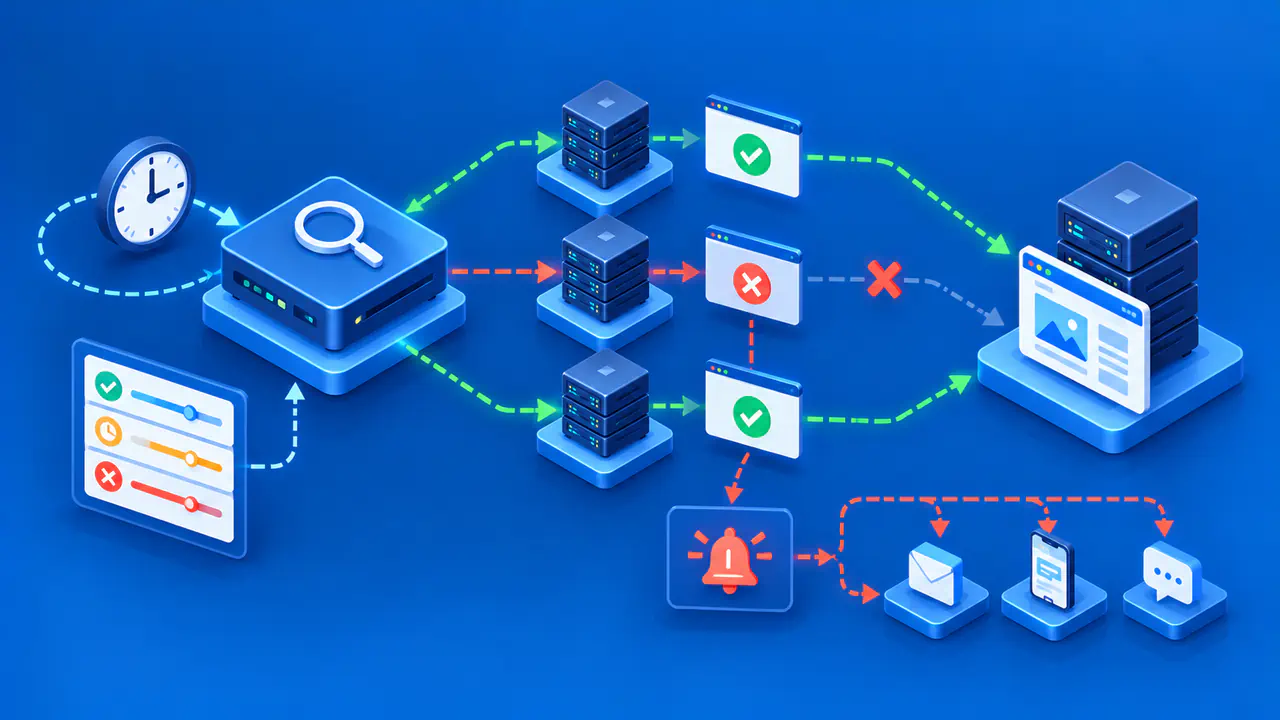
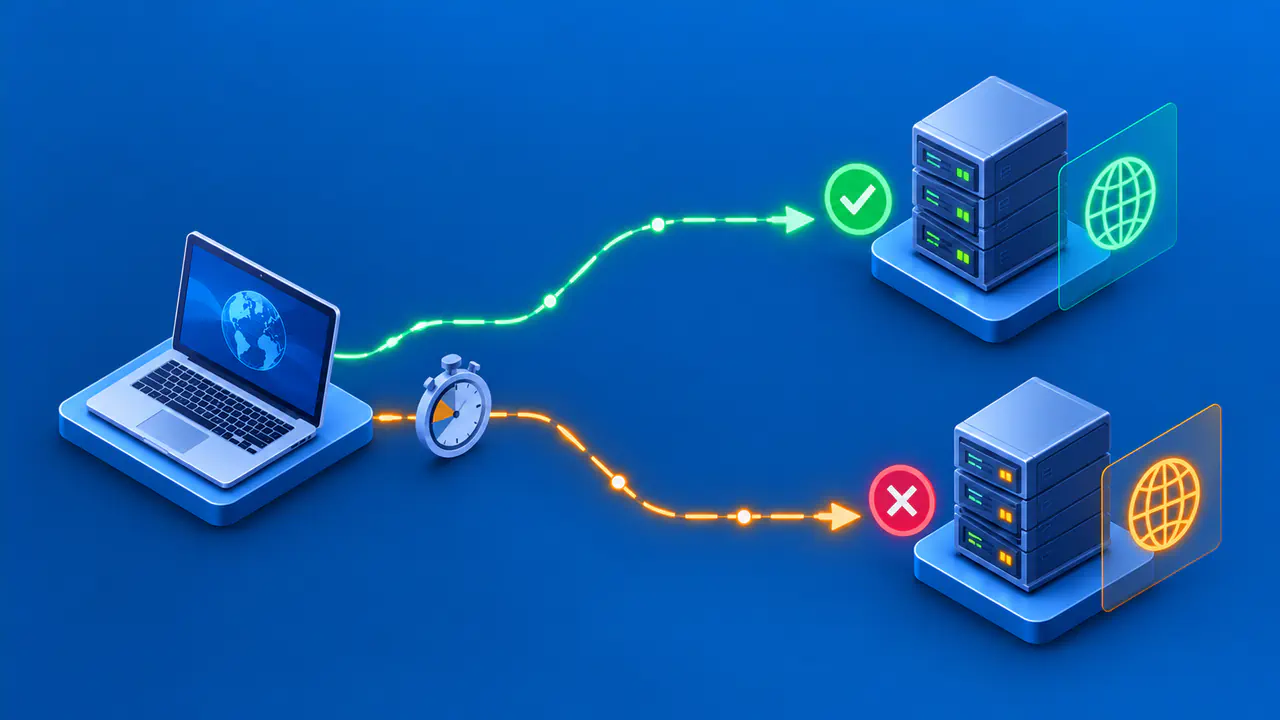
An external website uptime monitor regularly requests a public URL and alerts a responder when the result does not meet the configured success rules. A simple HTTP monitor can detect an inaccessible page, an unexpected status, or a slow response that exceeds a timeout. A successful check does not prove that every visitor can use every feature. Choose a URL for the part of the website you need to keep available, then define what a successful response should contain.
Better Stack can run these checks independently of your web server and notify an on-call responder. This external check serves a different purpose from an internal health check used to select working servers: the external monitor tests whether a request can reach the public website. Both can be useful, since a running application may still be inaccessible from outside its hosting network.
Choose an Endpoint and Success Condition
Select a stable HTTPS URL that matters to visitors. Monitoring the home page checks whether that page is available, while an application health endpoint can also test required dependencies. Decide which failure you want this monitor to report. For example, the home page may return HTTP 200 while checkout fails. A separate browser test can follow the checkout steps with test data to check behavior that a single page request does not cover. Keep any probe non-destructive and avoid embedding credentials in a URL.
Define success more precisely than “the server answered.” Better Stack's basic status monitor accepts HTTP status codes in the 2xx range. If the endpoint should return a particular code, use the expected-status option and specify the accepted response. A redirected URL may end at a login page or a different site, producing a successful final response while the original feature is unavailable. Decide whether redirects should be followed and inspect the final destination.
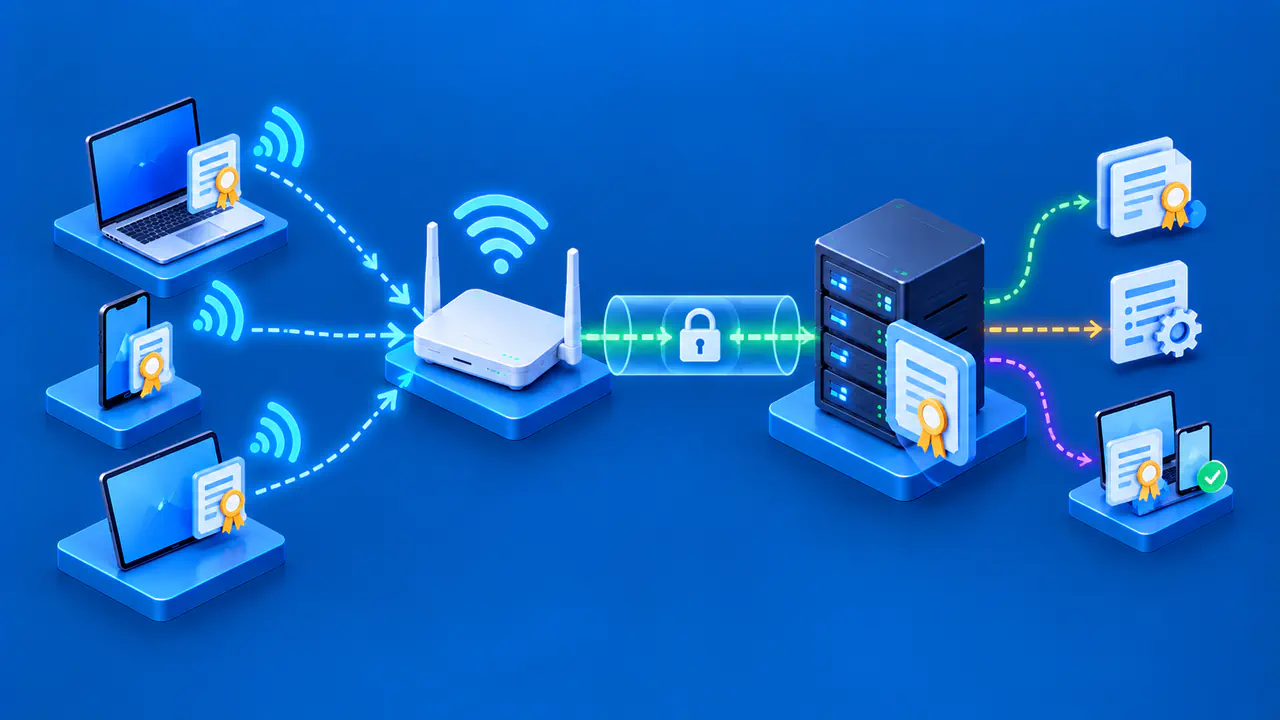
Keep TLS certificate verification enabled for an HTTPS monitor so certificate problems can cause a check to fail. The monitoring service also needs to resolve the public hostname and connect over the network. Those steps help reveal DNS and connection failures that a check made directly on the web server could miss.
Configure Request Timing and Content Checks
In Better Stack, open Monitors, choose Create monitor, and enter the URL. Select the HTTP monitor type and success condition, then use the advanced settings to configure timing. The check interval determines how often the service sends a request, while the request timeout limits how long a check waits for a response.
Choose the interval according to how quickly an outage needs to be detected. Set the timeout with enough allowance for normal response times and variation. An unnecessarily short timeout can produce false alarms, while a long timeout makes the monitor wait longer before treating a slow request as failed.
A confirmation period delays incident creation while Better Stack checks whether a failure persists. A recovery period requires successful checks for the configured duration before Better Stack automatically resolves the incident. Longer periods can reduce alerts from brief failures or unstable recovery, but also delay the corresponding status change. Choose both durations according to how much interruption is acceptable for the website.
A keyword monitor can check whether the response contains a phrase that should remain on the page. Choose text that will not disappear during routine content updates. If the test needs clicks, form entries, or JavaScript execution, a Better Stack Playwright monitor can run a browser scenario. Use dedicated test data and accounts for such scenarios so repeated checks do not create real orders or alter customer records.
Route Alerts to an Available Responder
An alert is actionable only if it reaches someone responsible for the service. Better Stack can notify the primary on-call responder or follow an escalation policy, which specifies who else should be contacted if the incident remains unacknowledged. Available channels include phone calls, SMS, email, and push notifications. Choose the route according to severity, on-call coverage, and how quickly the issue must be addressed. Check that notifications sent through the selected channel can reach the responder during the hours when the service needs coverage.
Give the monitor a name that identifies the service and environment. Keep a runbook, a short set of incident response instructions, available to the responder. Document who owns the service, who receives a second escalation, and what to check first. Reserve urgent channels for failures that require prompt action, so routine notifications do not obscure an outage.
Confirm that contact details and notification channels are current. If alerts are sent by email, check delivery into the actual inbox rather than assuming configuration is enough. Arrange notification tests with the responder in advance. Once the settings and recipients are ready, select Create monitor to save the configuration and start checks.
Test Failure Detection and Recovery
Use a controlled test endpoint to verify failure detection without taking the public site offline. Configure a temporary monitor with the timing and notification settings you intend to use, then make the test endpoint return an unexpected status or stop responding. Confirm that the failed checks lead to an incident and that the notification reaches the intended responder. Restore the endpoint and wait for the required successful checks before confirming recovery.
A manually created test incident can check incident notifications, but it does not establish that a URL check can detect a failure. Test the actual request and success rule as well. Keep test messages clearly labeled so responders do not mistake them for an unplanned outage.
Record the probe's observed response and the server's own logs for the same time. If checks fail from one monitoring location while requests from other networks succeed, investigate the failing network path or DNS resolution before classifying the problem as a sitewide outage. Test the route for both a response-code failure and a timeout if both are important to the service. Compare the recorded failure and recovery times with the settings to confirm that the delay is acceptable.
Review permissions before allowing a monitor to send authenticated requests. Store monitoring credentials securely and grant only the permissions needed for the check. Update the monitor when those credentials change. A public availability check often avoids this complexity. Checks that require a logged-in account need separate authentication and test-data settings from a basic public page check.
Review False Alarms and Coverage Gaps
After deployment, compare alerts with visitor reports, application metrics, and access logs. If isolated failures keep appearing in one monitoring region, compare the results with checks from another region before changing alert thresholds. Do not suppress a recurring alert solely to improve an uptime percentage; investigate whether it reflects a real regional, DNS, certificate, or network problem.
A single probe location cannot establish global availability. Different visitors can use different DNS answers, CDN edges, networks, or browsers. For a service used across regions, compare checks from multiple locations with reports of actual visits and the application's own logs. Successful checks show that the configured requests passed; they do not establish that every browser or account can use the site.
Review the monitor after site migrations, redirect changes, and new deployments. Update the endpoint when the public URL changes, and confirm alert ownership during staffing changes. Record the monitor settings, date, expected failure, observed alert delivery, and recovery result. Retest notification delivery when the responsible team or alert channels change.